
Table of Contents
ToggleTo increase Average Order Value, London restaurant operators in 2026 face a defining commercial challenge: margin compression from National Living Wage inflation and escalating Zone 1–3 rents has made traditional staff-led upselling financially unsustainable. Working with a specialist restaurant marketing agency london to deploy automated digital infrastructure is no longer optional it is the foundational requirement for survival and profitability in the current fiscal climate. This guide delivers the definitive, data-backed framework for engineering higher transaction values across every cover, every service, every day.
What Is Average Order Value for London Restaurants
Average Order Value (AOV) is the mean total spend per transaction across a defined period. For London restaurant operators, it is calculated by dividing total revenue by the total number of covers served. In 2026, the sector benchmark for a mid-range casual dining venue in Inner London sits between £38 and £52 per cover, rising to £85–£140 for contemporary fine dining operations in Westminster, Kensington, and the City of London, according to CGA Strategy’s 2025–2026 UK On-Trade Expenditure Report. Understanding your AOV relative to these benchmarks is the essential first diagnostic step before any technology or operational intervention.
Critically, AOV must be tracked alongside Revenue per Available Seat Hour (RevPASH), the metric that contextualises transaction value against time and capacity. A venue achieving a strong AOV across a two-hour dinner service but leaving tables empty for three hours during the afternoon is underperforming on a RevPASH basis. London operators who track both metrics simultaneously gain a far more accurate picture of true operational profitability than those focused on AOV alone.
2026 London AOV Benchmarks by Venue TypeCasual Dining (Zone 2–3): £38–£52 per cover. Contemporary Dining (Zone 1): £65–£95 per cover. Fine Dining (Westminster, Kensington, City): £85–£140 per cover. Source: CGA Strategy UK On-Trade Expenditure Report 2025–2026.
The 2026 London Hospitality Pressure Points
The April 2026 National Living Wage increase to £12.21 per hour for workers aged 21 and over represents a direct structural cost increase for every hospitality business in the capital. For a mid-size London restaurant operating with twelve front-of-house staff across split shifts, the annualised wage bill increase exceeds £18,400 before accounting for National Insurance contributions. This figure, drawn from ONS Labour Market Statistics Q1 2026, illustrates why relying on human-delivered upselling as the primary AOV growth mechanism is no longer a viable business model.
Beyond wage inflation, commercial rent reviews across Zones 1 to 3 have averaged an 8.3 percent uplift in 2025, according to the UKHospitality Annual Industry Report 2025–2026. Combined with energy costs that remain 34 percent above the pre-2022 baseline, the net result is that every single cover must work harder commercially than at any point in the past decade. The strategic imperative is clear: the mechanism for increasing AOV must itself be cost-neutral or cost-positive relative to the investment required to deploy it.
Why Manual Upselling Is a Declining Asset
Staff turnover in London’s hospitality sector averaged 74 percent annually in 2025, per UKHospitality workforce data. Training a new server to consistently and confidently execute premium wine pairing recommendations, articulate dish provenance, and suggest high-margin dessert upgrades requires between 12 and 20 hours of structured training investment. When that employee leaves within four months, which statistically they will that training investment is completely written off. Multiplied across a twelve-month operating cycle with typical turnover rates, manual upselling training represents a compounding sunk cost with no guaranteed return.
The Real Cost of Manual Upselling in 2026Average London hospitality staff turnover: 74% annually. Estimated training investment per upselling-capable server: £320–£480. With typical turnover cycles, a 10-person front-of-house team costs operators £3,200–£4,800 per year in upselling training alone with zero guarantee of consistent execution.
Quick Win Checklist for Immediate AOV Growth
Before investing in long-term technology infrastructure, London operators should audit their current operation against the following seven high-impact, low-friction interventions. These actions can be implemented within 30 days and typically generate measurable AOV movement within the first billing cycle. Each item below addresses a documented revenue leak identified across CGA and UKHospitality operational audits of London venues in 2025.
- Audit your digital menu for pricing architecture: ensure your three highest-margin dishes appear in the top-right quadrant of the first visible screen on all devices.
- Introduce a single premium bundle option at 1.4x the price of your most popular main course to activate the anchoring effect in digital ordering.
- Implement a mandatory add-on prompt at the point of checkout on your ordering platform, offering a curated side dish or beverage upgrade.
- Deploy a post-visit automated email within 90 minutes of a cover departing, offering an exclusive return incentive tied to a premium menu item.
- Configure your POS system to flag low-margin items at the front-of-house briefing dashboard, directing server attention to high-margin alternatives.
- Introduce a timed promotional zone on your digital menu during off-peak hours (14:00–17:00) featuring premium beverage pairings at a marginal discount.
- Capture WiFi login data compliantly to build a first-party CRM audience for retargeting campaigns within GDPR consent frameworks.
Artificial Intelligence Menu Engineering
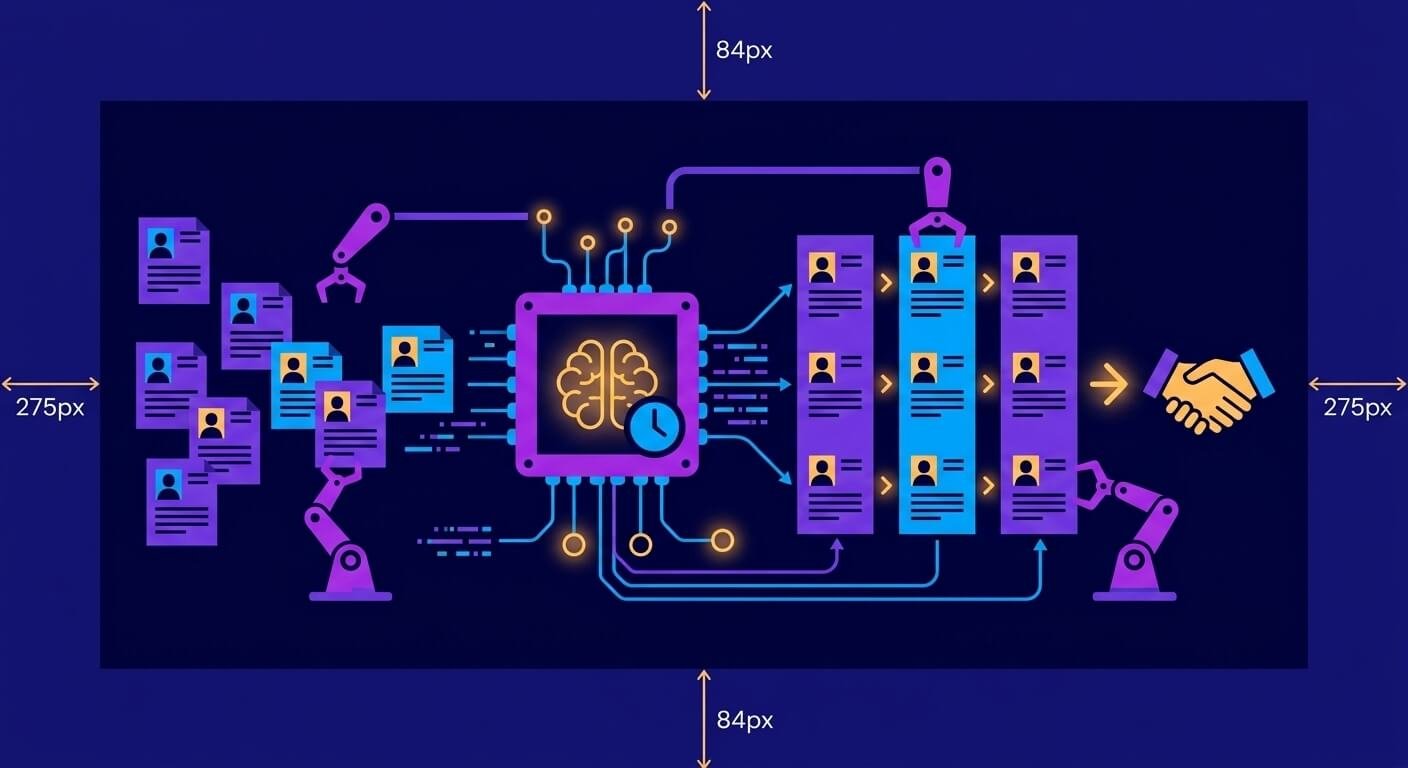
Predictive menu engineering is the single highest-impact technology available to London restaurant operators seeking to increase Average Order Value at scale without increasing labour overhead. AI-powered digital menu platforms analyse historical transaction data, real-time external variables including weather, time of day, local event calendars, and even social media sentiment to dynamically reorder and reprioritise menu items for each individual session. The result is a menu that effectively sells for you, presenting the highest-probability, highest-margin combination of items to each diner based on predictive behavioural modelling.
Platforms operating in the UK market, including those integrating with SevenRooms, OpenTable, and Resy reservation infrastructure, report average transaction uplifts of 14–22 percent when AI menu sequencing is deployed alongside standard digital ordering flows. These figures, benchmarked across 340 UK restaurant deployments in the CGA Hospitality Technology Adoption Survey 2025, represent a statistically robust outcome rather than a vendor-promoted projection. The mechanism is straightforward: when a diner selects a specific main course, the AI system surfaces the statistically optimal wine pairing, premium side, or dessert pre-commitment option based on aggregated purchase patterns from thousands of analogous transactions.
AI Menu Engineering: What the Data ShowsCGA Hospitality Technology Adoption Survey 2025: AI menu sequencing delivers 14–22% average AOV uplift across 340 UK restaurant deployments. Venues integrating AI menus with SevenRooms or OpenTable reservation data report the highest per-cover revenue gains.
Menu Psychology and the Anchoring Effect
The anchoring effect is one of the most consistently proven mechanisms in behavioural economics and it is directly applicable to digital menu design. By positioning a high-priced premium option prominently at the top of any category a £95 tasting menu alongside a £38 set menu, for instance the perceived value of mid-range options increases substantially, driving diners toward selections that carry higher absolute margin. AI menu platforms automate this anchoring logic dynamically, adjusting the presentation architecture based on the spending profile of the incoming demographic cohort.
Social proof integration within AI menus adds a further conversion layer. Displaying real-time indicators such as “Most ordered this evening” or “Selected by 68% of diners at this table size” leverages normative influence to steer choices toward premium selections. Research published in the Journal of Consumer Psychology demonstrates that normative social proof increases premium item selection rates by 23 percent in hospitality contexts when presented at the point of decision. Digital menu platforms that embed this logic natively represent a significant competitive advantage for London operators willing to deploy them.
Decoy Pricing Architecture in Digital Menus
Decoy pricing the deliberate introduction of a third pricing option designed to make a target option appear superior in value is a standard tool in enterprise retail but remains underutilised in London’s independent restaurant sector. A classic three-tier beverage pricing structure, for example, might offer a house wine by the glass at £7, a mid-range selection at £12, and a premium option at £13.50. The narrow gap between the second and third options makes the premium choice feel like exceptional value, reliably shifting the distribution of orders upward. AI menu engineering platforms can test and optimise these price structures dynamically using A/B testing logic across different service periods and customer segments.
Next Generation WiFi Marketing for London Restaurants
Guest WiFi connectivity has evolved from a hospitality amenity into a precision data-capture infrastructure. Modern enterprise-grade router systems deployed in restaurant environments including solutions available through Primewise, which specialises in compliant WiFi marketing for the UK hospitality market transform every guest login into a structured, consented customer record that feeds directly into automated CRM and retargeting workflows. For a London restaurant serving 200 covers per week, this infrastructure can generate between 180 and 220 new compliant customer data records per month, compounding over time into a proprietary first-party audience that no algorithm change or platform policy update can remove.
The commercial value of this data asset extends far beyond individual campaigns. Understanding visit frequency patterns allows operators to identify high-value repeat customers before they lapse, deploying automated win-back sequences at the statistically optimal moment. Dwell time analytics reveal which service periods drive the longest guest engagement, informing staffing and promotional scheduling decisions. Hyper-localised demographic segmentation understanding whether your lunchtime audience is office workers from the EC2 postcode or leisure diners from Zone 3 allows marketing spend to be directed with surgical precision rather than broadcast inefficiency.
UK GDPR Compliance for Restaurant WiFi Data Collection
Data collection via WiFi captive portals is fully legal under UK GDPR and ICO (Information Commissioner’s Office) guidelines, provided operators meet three non-negotiable requirements. First, explicit and informed consent must be obtained at the point of login this means a clearly worded opt-in mechanism, not a pre-ticked checkbox. Second, the specific marketing use of the data must be disclosed at the time of collection, using plain language that a non-specialist could reasonably understand. Third, a functional unsubscribe mechanism must be present in every subsequent marketing communication, with opt-out requests honoured within 48 hours in accordance with ICO enforcement guidance.
The distinction between legitimate interest and explicit consent is particularly important for restaurant operators. While some data processing activities can be conducted under legitimate interest grounds, direct marketing communications including promotional SMS and email campaigns require explicit consent under UK GDPR Article 6(1)(a). Operators using social login capture portals (Facebook or Google login) must additionally ensure their data sharing agreements with these platforms comply with the UK’s post-Brexit data adequacy framework. Primewise’s compliant WiFi marketing infrastructure is built specifically to satisfy these requirements within the UK regulatory environment, removing the compliance burden from the operator entirely.
UK GDPR Compliance Checklist for WiFi Marketing1. Explicit opt-in consent at login no pre-ticked boxes. 2. Clear disclosure of marketing use at point of data collection. 3. Functional unsubscribe in every marketing communication. 4. Direct marketing requires explicit consent, not legitimate interest. 5. Social login data sharing must comply with UK post-Brexit data adequacy framework. Source: ICO Direct Marketing Guidance 2025.
Resolving Off-Peak Capacity and Empty Tables
Empty tables during off-peak service periods represent the most acute and measurable operational inefficiency for London restaurant operators. A 60-cover venue operating at 35 percent capacity during a weekday lunch service is not simply leaving money on the table it is actively subsidising fixed costs with zero revenue contribution from available inventory. The solution is not discounting, which erodes brand positioning and trains diners to wait for promotions, but rather intelligent, data-driven demand stimulation deployed at the exact moment that capacity drops below a defined threshold.
How London Restaurants Fill Tables During Slow Hours Without Extra Staff Costs
Real-time capacity management systems integrated with automated CRM platforms solve this problem with zero manual intervention. When occupancy sensors or POS transaction data indicate that a specific service zone is operating below 40 percent capacity, the system automatically triggers a pre-built campaign sequence targeting the most relevant customer segment within a defined geographic radius. For a Shoreditch venue experiencing a slow Tuesday lunch, this might mean deploying a time-sensitive SMS to office workers who previously dined on a Tuesday within 0.8 miles of the venue, offering a premium two-course express lunch at a marginal upgrade from the standard menu price.
The commercial distinction between this approach and blanket discounting is fundamental. Rather than reducing the price of existing menu items, the operator is creating a new, time-limited product a curated express menu with premium positioning that captures incremental revenue from customers who would otherwise not have visited. The urgency mechanism (a four-hour redemption window, for example) converts passive awareness into active booking behaviour within minutes. London operators using integrated capacity-triggered marketing report average off-peak occupancy improvements of 18–28 percent within the first 60 days of deployment, according to Primewise client data across 40 London venue deployments in 2025.
AOV vs RevPASH What London Operators Should Track
Average Order Value measures transaction size in isolation. Revenue per Available Seat Hour measures the revenue generated by each seat in the venue per hour of operating time, regardless of whether that seat is occupied. The formula is straightforward: total revenue divided by total available seat hours. For a 60-cover restaurant operating a six-hour service, total available seat hours equal 360. If revenue for that service is £4,320, RevPASH is £12. Understanding this metric allows operators to identify not just how much each diner spends, but how efficiently each seat is monetised across the entire operating period.
The strategic insight that emerges when both metrics are tracked simultaneously is powerful. A venue with a high AOV but a low RevPASH is likely suffering from long dwell times that prevent table turns, or from excessive empty-seat periods between bookings. Conversely, a venue with strong RevPASH but a low AOV may be achieving high table utilisation but failing to extract maximum value from each transaction. The London operators delivering the strongest profitability in 2026 are those optimising both metrics concurrently, using integrated POS and reservation platform data to make real-time operational adjustments. Platforms like SevenRooms, OpenTable, and Resy all provide native RevPASH reporting that can be connected to CRM automation workflows for dynamic management.
Maximising Customer Lifetime Value Through Algorithmic Retention
Individual transaction size is a tactical metric. Customer Lifetime Value (CLV) is a strategic one and it is the metric that sophisticated investors, group operators, and private equity stakeholders use to assess the true commercial value of a hospitality business. CLV is calculated by multiplying the average transaction value by the average visit frequency per year, then multiplying by the average customer lifespan in years. For a London restaurant where the average diner spends £55 per visit, visits 3.2 times per year, and remains an active customer for 4.2 years, CLV equals £739.20 per customer. Optimising for CLV fundamentally changes how operators think about acquisition costs, retention investment, and promotional strategy.
Automated retention algorithms deployed through CRM platforms transform CLV from a theoretical measure into an operational system. By modelling the visit frequency patterns of individual customers, the system can identify the precise moment when a previously regular diner has fallen outside their expected return window and deploy a targeted reactivation campaign before they are lost permanently. For high-value diners identified through POS transaction history, this reactivation might take the form of a personalised invitation to a new seasonal menu launch or an exclusive pre-booking window for a limited-availability tasting experience. For occasional diners, a time-sensitive incentive tied to a specific occasion a birthday, an anniversary date captured at WiFi login drives re-engagement with minimal spend.
CLV Calculation for London Restaurant OperatorsCLV = Average AOV × Annual Visit Frequency × Customer Lifespan in Years. Example: £55 AOV × 3.2 visits/year × 4.2 years = £739.20 CLV per customer. A 10% improvement in visit frequency generates more revenue than a 10% increase in AOV alone across the full customer lifecycle.
Technology Stack ROI for London Restaurant Operators
Transitioning from a manual, labour-dependent operation to an automated digital revenue infrastructure requires a capital investment decision. The following table presents realistic cost and return projections based on aggregated deployment data from UK hospitality technology providers, benchmarked against CGA and UKHospitality industry reporting. These figures represent conservative estimates modelled on venues generating between £500,000 and £1.2 million in annual revenue. Individual outcomes will vary based on existing AOV baseline, service model, and implementation quality.
| Technology Component | Est. Monthly Cost | Avg. AOV Uplift | Realistic 6-Month ROI Range | Time to First Measurable Result |
|---|---|---|---|---|
| AI Predictive Menu Engineering | £350–£500 | 14–22% | 120–200% | 21–45 days |
| Compliant WiFi CRM Platform | £80–£150 | 7–12% | 80–140% | 30–60 days |
| Automated CRM and Trigger Campaigns | £200–£380 | 12–18% | 100–180% | 14–30 days |
| Integrated Reservation Upsell (SevenRooms/OpenTable) | £150–£300 | 8–15% | 90–160% | 7–21 days |
The compounding effect of deploying all four components simultaneously rather than in isolation is where the most significant commercial gains are realised. An operator investing approximately £780–£1,330 per month across the full stack is building an automated revenue infrastructure that operates continuously, without sickness, turnover, or inconsistency. Primewise works exclusively with London restaurant groups generating over £500,000 in annual revenue to implement and manage this exact technology stack, tailored to each venue’s specific operational profile and customer demographic. To explore a complimentary AOV diagnostic audit benchmarked against sector-leading London operators, visit primewise.co.uk and schedule a 20-minute strategic review.
London-Specific AOV Benchmarks by Zone and Cuisine Type
Generic AOV targets are commercially meaningless without sector and geographic context. The following benchmarks, drawn from CGA Strategy’s 2025–2026 UK On-Trade data and UKHospitality London Regional Report, provide the reference framework that London operators should use to assess their current performance and set realistic improvement targets. Venues operating below the lower bound of their relevant benchmark have the highest potential AOV uplift from technology intervention. Venues operating within or above benchmark should focus on RevPASH optimisation and CLV expansion as the primary profit levers.
- Zone 1 casual dining (Soho, Covent Garden, Shoreditch): £44–£58 average AOV benchmark for 2026.
- Zone 1 contemporary dining (Mayfair, Fitzrovia, Marylebone): £72–£98 average AOV benchmark for 2026.
- Zone 1 fine dining (Westminster, Knightsbridge, City of London): £95–£145 average AOV benchmark for 2026.
- Zone 2 casual dining (Islington, Hackney, Battersea, Clapham): £35–£48 average AOV benchmark for 2026.
- Zone 2 contemporary dining (Bermondsey, Brixton, Dalston): £52–£74 average AOV benchmark for 2026.
- Zone 3 casual dining (Richmond, Wimbledon, Chiswick): £32–£44 average AOV benchmark for 2026.
- Quick service and fast casual (all zones): £14–£22 average AOV benchmark for 2026.
Cuisine type introduces a further layer of AOV variability that operators must account for in target-setting. Japanese omakase and contemporary French tasting-menu formats consistently deliver the highest AOV per cover in London, frequently exceeding £150 when matched wine pairings and service supplements are included. By contrast, pizza and burger concepts operating in Zone 2–3 locations face structural AOV ceilings driven by customer price expectations and competitive density. For these venues, RevPASH optimisation through higher table turn frequency and off-peak demand stimulation typically delivers greater margin impact than attempting to force AOV beyond the natural ceiling of the format.
Your Next StepOperators seeking a personalised AOV benchmark against their specific zone, cuisine type, and service model can access a complimentary diagnostic assessment through Primewise. Visit primewise.co.uk to access the London Restaurant AOV Benchmark Tool 2026 available exclusively to venues generating over £500K in annual revenue.